Make a table of values, for example:
| x |
y=f(x)=x3+6x2+12x+6 |
| -2 |
-8+24-24+6=-2 |
| -1 |
-1+6-12+6=-1 |
| 0 |
6 |
| 1 |
1+6+12+6=25 |
| 2 |
8+24+24+6=62 |
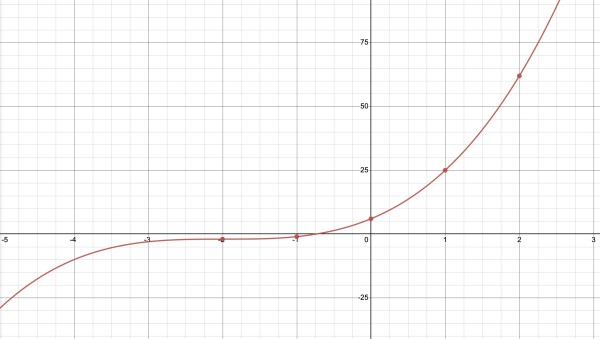
Plot these 5 points on the graph (-2,-2), (-1,-1), (0,6), (1,25), (2,62).
The graph is narrow so the x-axis only has to be about 4 units wide to accommodate x=-2 to x=2.
The y-axis has to accommodate a range of about 64 units. Arrange the scales of the axes to fit the graph paper comfortably. The graph should also give a good impression of the overall shape. Draw a curve to fit through all the points and you will get some idea of what the graph looks like beyond x=2 (more positive) and x=-2 (more negative).
The picture shows the points on the curve.