When x=0, y=-16 (y-intercept). Mark (0,-16).
There should be 3 turning points because the derivative of a quartic is a cubic which has three zeroes, each indicating a turning point.
The easiest way to sketch the graph is to start with a table:
| x |
y |
| -5 |
599 |
| -4 |
192 |
| -3 |
11 |
| -2 |
-40 |
| -1 |
-33 |
| 0 |
-16 |
| 1 |
-13 |
| 2 |
-24 |
| 3 |
-25 |
| 4 |
32 |
| 5 |
219 |
Plug the x values into the polynomial to find y.
Next, we inspect the table. We can discard x=-5 and x=5 because of the size of the values. The lowest value of y is -40 and the highest 192, giving us a range of 192-(-40)=232. the range of x is -4 to 4, that is, 8 units, so these two ranges give us an idea of scale for the graph. An A4 sheet of graph paper gives us a working area measuring about 18cm by 25cm (250mm). This conveniently fits the ranges. if the paper is in portrait (rather than landscape) orientation. So vertically 1mm represents a unit, while horizontally a unit is 2cm. The origin will be somewhere on a vertical line dividing the graph into two equal halves. If we take the vertical range to be -50 to 200 we can easily accommodate the range -40 to 192. The horizontal range is -4.5 to 4.5. This puts the origin 50mm from the bottom of the page and on the central line of the paper.
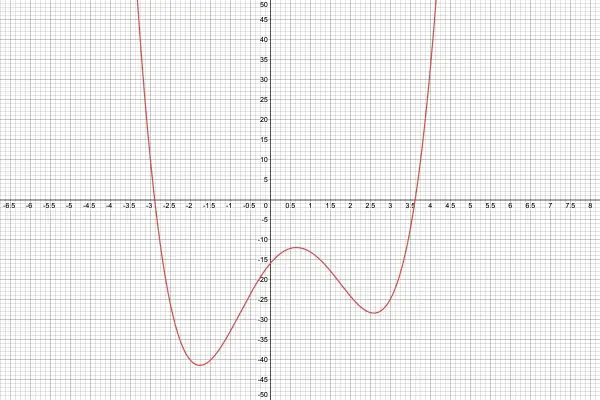
The next step is to plot the points according to the table (-4,192), (-3, 11), (-2,-40), etc., using the scales above.
Now it's just a matter of joining the plotted points and use your judgment to draw curves rather than straight lines. Note that the curve crosses the x-axis between (-3,11) and (-2.40), and between (3,25) and (4,32). These intersections corresponds to x-intercepts. Note also where the graph is decreasing and increasing. Remember there should be three turning points. The table shows a decrease between the first three plotted points, but then the next two points show an increase followed by a decrease for the next two points and then an increase as the graph intersects the x-axis. Another feature to note is that the graph stays below the x-axis (y is negative) between (-2,-40) and (3,-25), indicating that there are only two x-intercepts, making two zeroes of the polynomial complex. One of the plotted points (0,-16) is the y-intercept we found earlier.
This completes the graph.
