When x is large and positive or negative the expression approximates to x^2/x^2=1 and 1<2.
When x is close to zero the expression approaches 1/1=1.
If 2(x^2+x+1)=3(x^2+1), 2x^2+2x+2=3x^2+3, x^2-2x+1=(x-1)^2=0 and so x=1. So at x=1 the expression = 2/3.
If x^2+1=2x^2+2x+2, x^2+2x+1=(x+1)^2=0 and so x=-1. So at x=-1 the expression = 2.
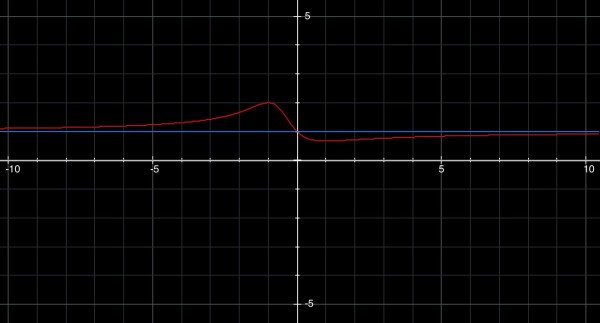
The graph shows the peak at (-1,2) and trough at (1,2/3). The blue line is at y=1 and shows as an asymptote for large positive and negative values of x. The y intercept shows the curve crossing y=1 to go from being above the asymptote line to below it. The graph demonstrates that the curve always lies in the range [2/3,2].
