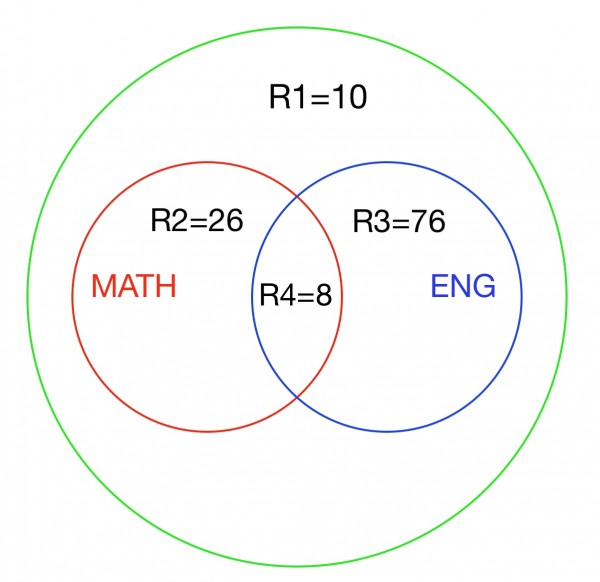
The Venn diagram shows circles: red for mathematics students and blue for English students. The green circle encompasses all 120 students. Those outside the red and blue circles are students taking neither subject. The 4 regions R1-R4 are defined as follows:
R1: Students taking neither subject
R2: Mathematics only students
R3: English only students
R4: Students taking both subjects.
R1+R2+R3+R4=120
R2+R4=mathematic students, R3+R4=English students.
R2+R4=(R3+R4)/3+6, 3R2+3R4=R3+R4+18, 3R2-R3=18-2R4.
R4=8, R1=10, so 3R2-R3=18-16=2.
R2+R3=120-8-10=102. This is the number of students who only study mathematics or English, but not both.
(Adding two equations together: 3R2-R3+R2+R3=2+102=104.
4R2=104, R2=104/4=26, so R3=102-R2=76. MATH=34, ENG=84.)
So 102 students take only one subject.
