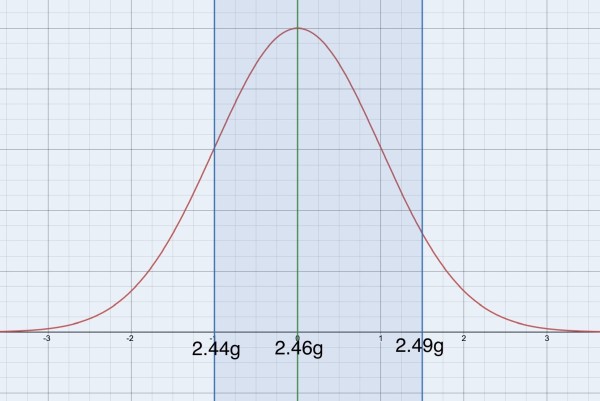
The area under the normal distribution curve represents the probability distribution. To "normalise" the given statistics so that the mean is at Z=0 (weight=2.46g) and Z=±1 represents a deviation from the mean of one standard deviation above or below the mean (that is, to the right or left of the mean), the formula applies:
Z=(X-μ)/σ, where X is the weight of the coin in a sample, μ is the mean and σ is the standard deviation. This formula tells us how many standard deviations from the mean the value X represents. Negative values are below the mean and positive values are above the mean.
When X=2.44 Z=(2.44-2.46)/0.02=-1 standard deviation below the mean.
When X=2.49 Z=(2.49-2.46)/0.02=1.5 standard deviations above the mean.
So the shaded region between the curve and the horizontal Z axis between these Z values represents probability. The total area under the curve has to be 1 (that is, 100%), representing all possible outcomes. In this case, the probability that the weight of a penny is between the Z limits -1 and 1.5, corresponding to between 2.44g and 2.49g, is the given value of 0.7745 (77.45%). This implies that the probability of the weight being outside these limits is 0.2255 (22.55%). Note the symmetry of the curve about the mean. The unshaded "tails" show that the probability of the weight being less than 2.44g is greater than the probability that it's greater than 2.49g. In the picture, be aware that the red curve never actually reaches the Z axis but just gets closer to it (the Z-axis is an asymptote).