The accompanying table shows the operating revenue, in millions of dollars, of wired and wireless telecommunications carriers in the United States in the given year.

Year Wired Wireless
2005 205.7 140.0
2006 195.6 157.5
2007 197.0 173.8
2008 194.8 184.8

Calculate the regression line for each type of carrier. (Let t be the time in years since 2005, R be the operating revenue of wired carriers and L be the revenue of wireless carriers. Round your regression parameters to two decimal places.) 

R =  

L =  


Determine the revenue level at which the two lines cross. Round your answer for the revenue level to one decimal place. 
_________ million dollars

in Word Problem Answers by

Your answer

Your name to display (optional):
Privacy: Your email address will only be used for sending these notifications.
Anti-spam verification:
To avoid this verification in future, please log in or register.

1 Answer

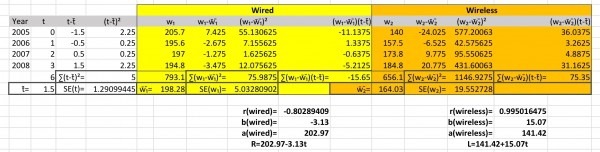
The above spreadsheet shows the data and statistical calculations. The linear regression equations are:

R=202.97-3.13t and L=141.42+15.07t.

The two lines intersect when

202.97-3.13t=141.42+15.07t, 202.97-141.42=15.07t+3.13t,

61.55=18.2t, so t=3.38, the equal revenues are $192.4 million.

by Top Rated User (1.1m points)

Related questions

0 answers
0 answers
0 answers
asked Feb 5, 2014 in Statistics Answers by anonymous | 1.1k views
0 answers
asked Nov 18, 2011 in Geometry Answers by anonymous | 1.2k views
1 answer
asked Oct 31, 2011 in Calculus Answers by anonymous | 716 views
Welcome to MathHomeworkAnswers.org, where students, teachers and math enthusiasts can ask and answer any math question. Get help and answers to any math problem including algebra, trigonometry, geometry, calculus, trigonometry, fractions, solving expression, simplifying expressions and more. Get answers to math questions. Help is always 100% free!
87,546 questions
99,701 answers
2,417 comments
474,806 users