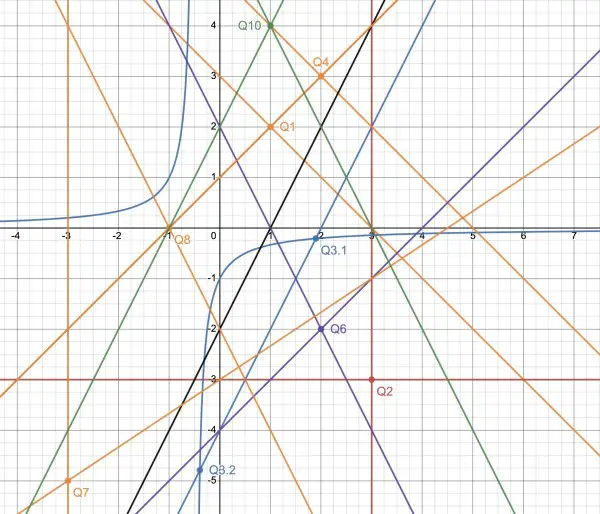
All the equations have been plotted on the same graph, but colour-coding has been used to make it easier to identify the intersections (where applicable) and hence the solutions.
(1) Add the equations: 2y=4, y=2, so x=1. See Q1(1,2) in orange.
(2) See Q2(3,-3) in red.
(3) 2x-4=-1/(2x+1), (2x-4)(2x+1)+1=0, 4x2-6x-3=0, x=(6±√(36+48))/8=(6±√84)/8=(3±√21)/4=0.75±1.1456.
x=1.8956, y=-0.2087; x=-0.3956, y=-4.7913. See Q3.1 and Q3.2 (blue). This is the only curve involved in your question.
(4) Add the equations: 2y=6, y=3, so x=2. See Q4 (orange).
(5) Black line implies many solutions.
(6) x-y=4, y=x-4; y=-2x+2, so x-4=-2x+2, 3x=6, x=2, y=x-4=-2. See Q6 (purple).
(7) 2x-3y=9, so -6-3y=9, 3y=-15, y=-5, 2x+15=9, 2x=-6, x=-3. See Q7 (orange).
(8) -x+y=1, 2x+y=-2. Subtract first eqn from second: 3x=-3, x=-1 so y=0. See Q8 (orange).
(10) Divide both eqns by 7: y=-2x+6, y=2x+2, so -2x+6=2x+2, 4=4x, x=1, y=4. See Q10 (green).