The function for pH is ambiguous in your question. Is it log(10t) or log[10](t)? I didn't draw the graph, partly because of this ambiguity. Log(10t) means to me log to the base 10 of 10t and log[10](t) means log to the base 10 of t. If you can clarify which meaning is intended (I think it's probably P(t)=-log to the base 10 of t) then I can attempt to show you the graph. Chemistry or physics textbooks use log to the base 10 of the hydrogen ion concentration. Here's one graph with zoom in:
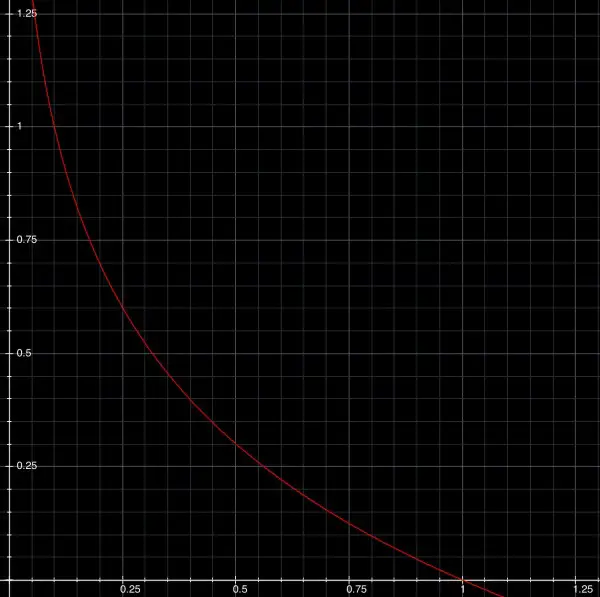
A pH of 1 corresponds to a H+ concentration of 0.1. A pH value of 0 corresponds to H+ of 1. The subdivisions of the horizontal scale are 0.05 steps. Two steps=0.1, with a pH of 1.
Ignore my original answers. I can come back to the other parts of your question in due course.
If the H+ concentration is increased by 0.50, then 0.5 becomes 0.75, 1 becomes 1.5, etc. So instead of 0.25, 0.5, 0.75 and 1 read off 0.375, 0.75, 1.125 and 1.5. For example, the pH for H+=.50 is about 0.3; if H+ is increased to 0.75, the pH drops to about 0.125.
If p(t)=-log(10t), then this is the same as p(t)=-(1+log(t))=-1-log(t) or p(t)+1=-log(t). This is a vertical displacement of the graph:
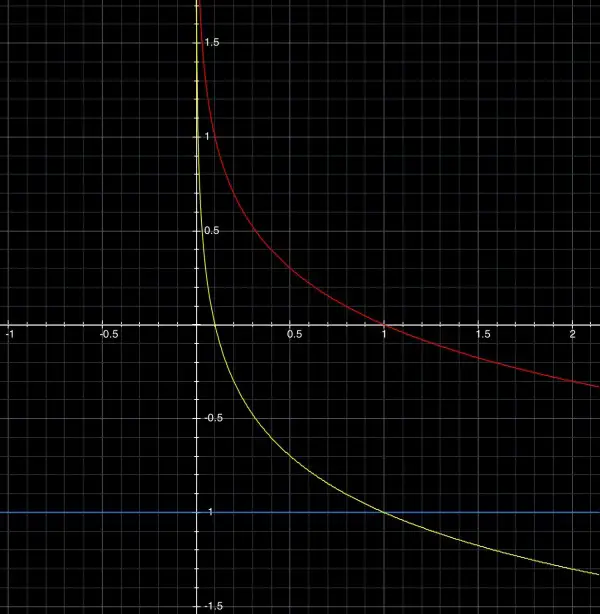
In this graph, the yellow curve corresponds to y=-1-log(t) and the blue line shows where the t-axis is displaced downwards by 1.
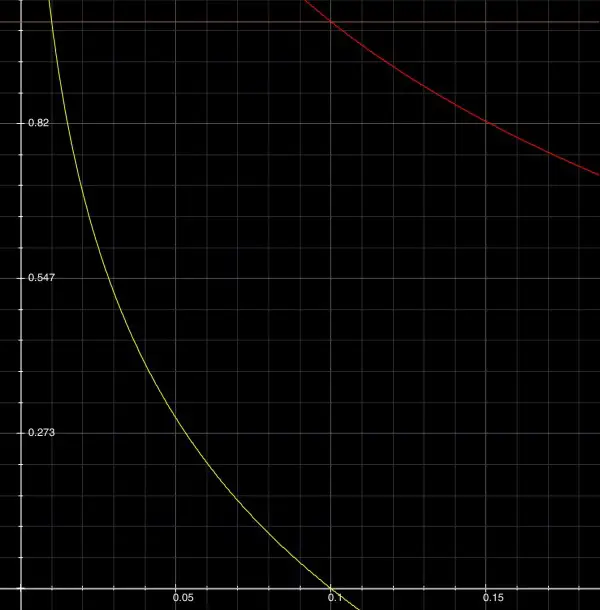
The horizontal tan line near the top of the graph is at pH=1 in this magnification. On the red curve t=0.1 but on the displaced yellow curve t=0.01 (10t=0.1).
10-y=0.50, so y=9.5 represents a pH value of 9.5 (green line):
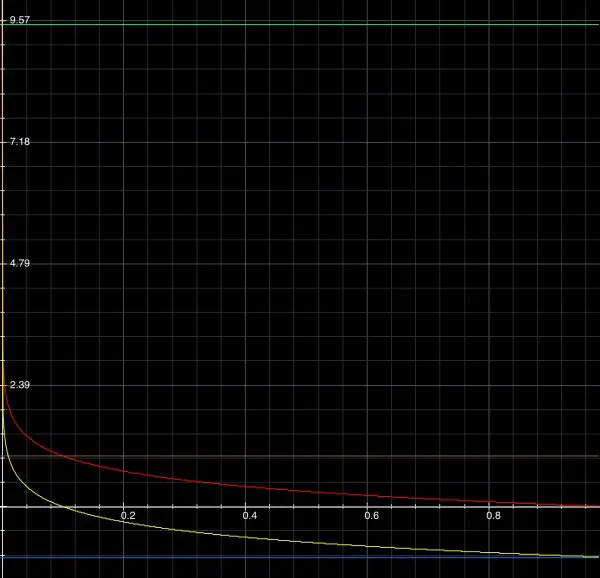
This means that the concentration of H+ is very low because the curve is almost touching the pH axis. For 9.50=-log(t), log(t)=-9.50=-10+0.50 so t=3.162*10^-10; for 9.50=-log(10t), t=3.162*10^-11.
p(t+1)=-log(10t+10); when t=0 this becomes -log(10)=-1. The yellow curve in graph 2 is displaced 1 to the left so that it cuts the pH axis at -1, the y-intercept.
