The graph is to scale but not to the one advised in the question.
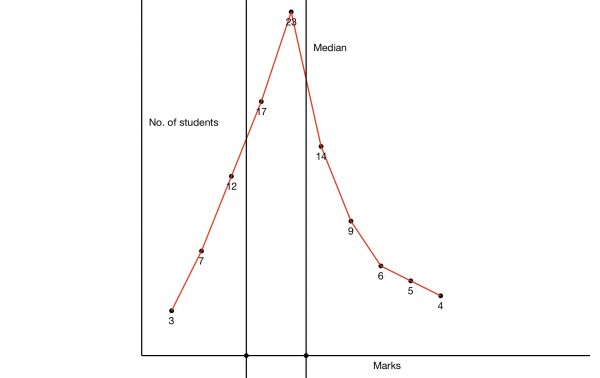
The median seems to correspond to a mark of 55 and a percentage of students around 18.5% (between 18 and 19 students).
The vertical fail-pass line is shown for 35 marks to the left of the median line. The line cuts the curve around 14.5, suggesting that 14 to 15 students get 35 marks. Then we need to add in those who get fewer. I think this total is represented by the area under the red curve, a rough triangle: 3+7+12+14.5=36.5% or between 36 and 37 students. If the question had 40 as the percentage pass mark, we would simply have to add 3+7+12+17=39 students, so 36.5 looks right.