Please help!!!
in Algebra 1 Answers by

Your answer

Your name to display (optional):
Privacy: Your email address will only be used for sending these notifications.
Anti-spam verification:
To avoid this verification in future, please log in or register.

1 Answer

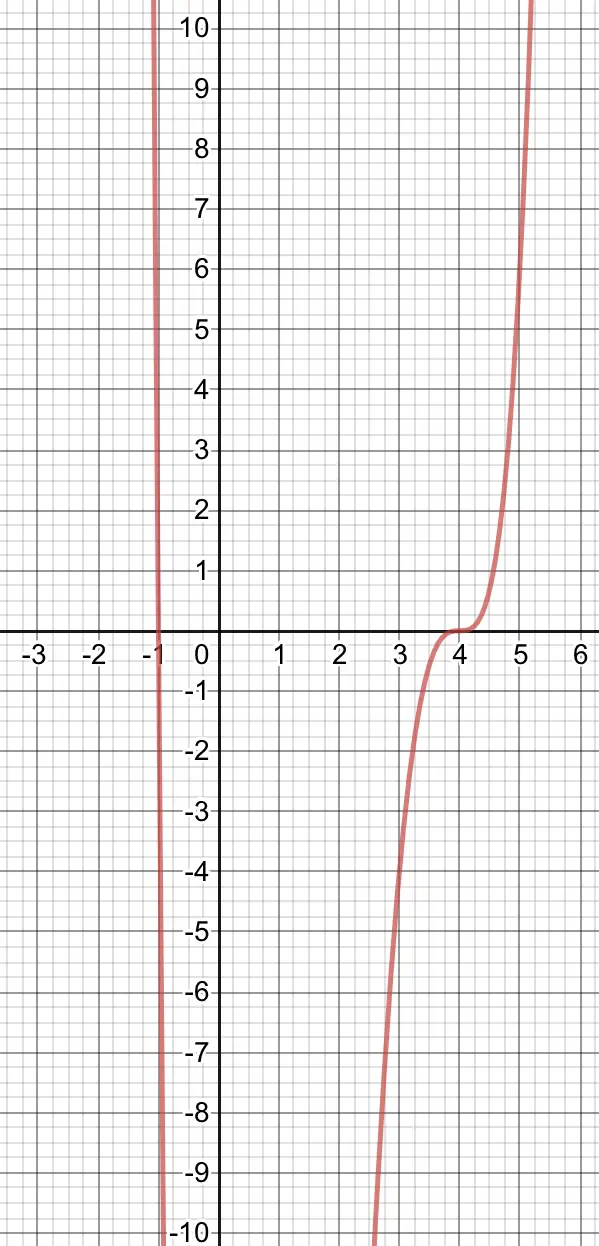
Find key points first. Intercepts are important. When is g(x)=0? The answer is: when x=4 and -1, so mark these points on the x-axis. Now, put x=0 into the function, that is, find g(0), to give you the y-intercepts: g(0)=-64. So mark -64 on the y-axis. Next, make out a small table with low values of x, say, x goes from -2 to 2. Work out corresponding values of g(x):

x    g(x)

-2  216

-1      0 (already marked as an x-intercept)

0   -64

1   -54

2   -24

There’s no need to plot these points but you can use them to see how steep the graph is. However, if you extend the table to include values of x near 4 you might realise there’s a “kink” at x=4.

Here are two pictures of the graph with different scales.

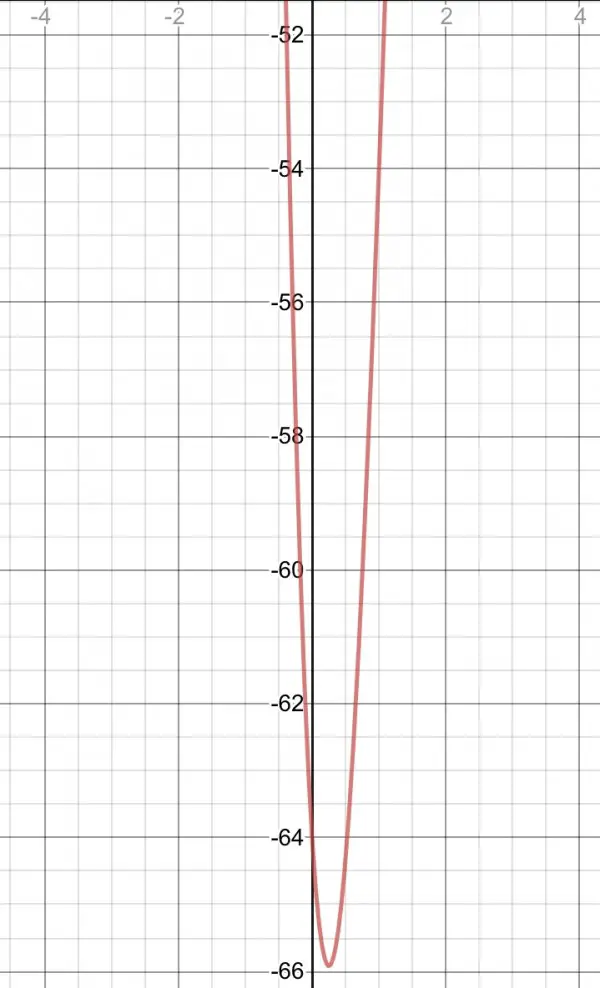
The lower graph shows the y-intercept and how the two parts of the graph shown in the upper graph join together near the y-intercept.

by Top Rated User (1.1m points)

Related questions

1 answer
1 answer
asked Jun 16, 2014 in Algebra 1 Answers by Dommy | 663 views
1 answer
2 answers
asked Nov 26, 2012 in Factors of a number by anonymous | 854 views
1 answer
1 answer
asked Apr 18, 2012 in Algebra 1 Answers by anonymous | 924 views
Welcome to MathHomeworkAnswers.org, where students, teachers and math enthusiasts can ask and answer any math question. Get help and answers to any math problem including algebra, trigonometry, geometry, calculus, trigonometry, fractions, solving expression, simplifying expressions and more. Get answers to math questions. Help is always 100% free!
87,542 questions
99,804 answers
2,417 comments
523,294 users