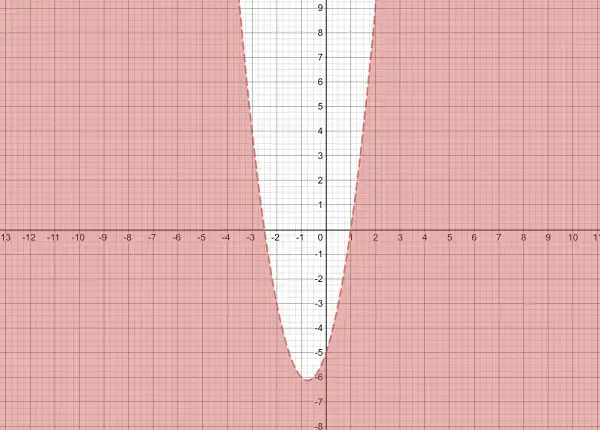
The graph shows the inequality as the shaded area outside the parabola.
y<2x²+3x-5, y<(2x+5)(x-1). When x<-5/2 or x>1, (2x+5)(x-1)>0. y is the height of the parabola above the x-axis. So, for example, when x=-3, we have (-1)(-4)=4. Therefore, above the point (-3,4) we are in the white area, but below the point we are in the shaded area, which represents all y values below the horizontal line y=4. Similarly, when x=2, we have (9)(1)=9. Above the point (2,9) we’re in the white area, but below it we’re in the shaded area, representing all y values below the line y=9. From this we deduce that the shaded area does indeed represent the inequality.