| x |
y=x (red) |
f(x)=x+⅔ (blue) |
g(x)=3x-4 (green) |
| 0 |
0 |
2/3 |
-4 |
| 5 |
5 |
17/3 |
11 |
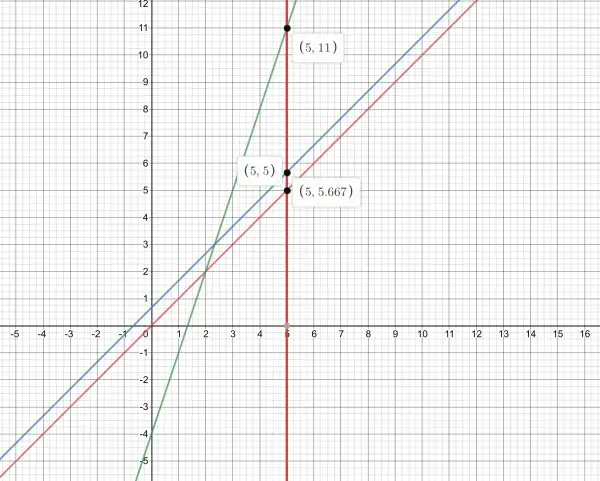
All the graphs are linear, so only two points are needed to draw straight lines, hence the table only needs two values of x. I’ve used x=0 and 5 and I’ve added the line x=5 to show the y/f(x)/g(x) values in the table. Please note that the point labelled (5,5) is on the red line and (5,5.667) on the blue line. The labels are close together, so it looks like the points are wrongly labelled.