indentify the quantities in the situation. assing a letter to each one.

sketch a diagram that shows the relastionship between quantities.

make a table that shows the relationship between quantities.

using letters,write a formula that represents the relationship between the quantities in this situation.
in Algebra 1 Answers by

Your answer

Your name to display (optional):
Privacy: Your email address will only be used for sending these notifications.
Anti-spam verification:
To avoid this verification in future, please log in or register.

1 Answer

Let M represent the measured weight according to the faulty scale, and let W represent the true weight. M and W are measured in pounds.

W=M-5.2 relates the true weight to the measured weight.

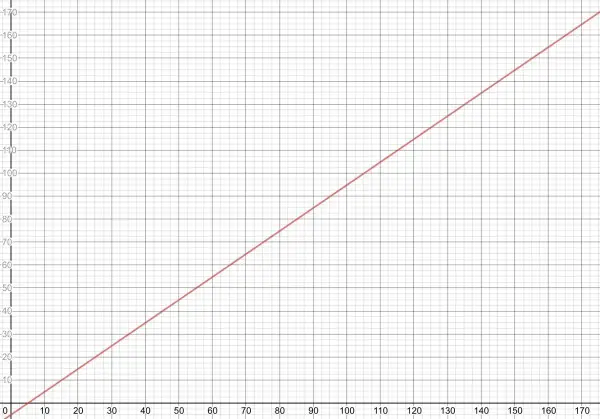
The graph shows weights up to about 175 pounds. The horizontal axis is M, the measured weight, while the vertical axis is W, the true weight. Only the part of the red line above the M axis is meaningful, because negative true weights are not possible.

The table below is a smaller scale than the graph and shows measured weights up to 15 pounds, and the table can be used with the graph to get accurate true weight values.

M pounds W pounds
5.2 0
6 0.8
7 1.8
8 2.8
9 3.8
10 4.8
11 5.8
12 6.8
13 7.8
14 8.8
15 9.8


by Top Rated User (1.1m points)

Related questions

1 answer
1 answer
1 answer
asked Oct 13, 2011 in Pre-Algebra Answers by anonymous | 815 views
1 answer
1 answer
1 answer
asked Jul 2, 2013 in Algebra 1 Answers by anonymous | 472 views
0 answers
asked Apr 26, 2013 in Algebra 1 Answers by anonymous | 469 views
Welcome to MathHomeworkAnswers.org, where students, teachers and math enthusiasts can ask and answer any math question. Get help and answers to any math problem including algebra, trigonometry, geometry, calculus, trigonometry, fractions, solving expression, simplifying expressions and more. Get answers to math questions. Help is always 100% free!
87,542 questions
99,768 answers
2,417 comments
504,627 users