How do you graph the linear inequality system where x+y>1 and x is less then or equal to y (x,=y).
in Algebra 1 Answers by

Your answer

Your name to display (optional):
Privacy: Your email address will only be used for sending these notifications.
Anti-spam verification:
To avoid this verification in future, please log in or register.

1 Answer

x+y>1, x≤y need to be written with y on the left:

y>1-x and y≥x.

Now draw graphs of y=1-x and y=x:

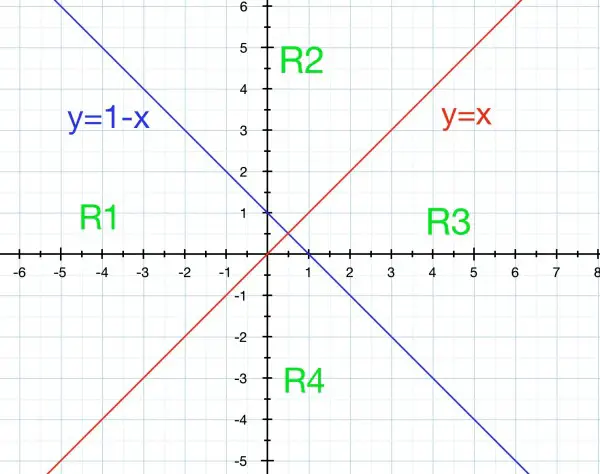
Each region corresponds to an inequality. We need the region where y>1-x, that is, above the blue line, and where y≥x, that is, above or on the red line. So the two inequalities are satisfied in R2. Remember to include all the points on the red line in this region but exclude the points on the blue line. In your graph you could shade the region R2 and indicate that the shading doesn’t include the blue line itself but does include the red line.

by Top Rated User (1.1m points)

Related questions

1 answer
1 answer
0 answers
1 answer
1 answer
asked Oct 18, 2019 in Algebra 1 Answers by anonymous | 872 views
1 answer
asked Dec 11, 2014 in Algebra 1 Answers by Adrian | 1.4k views
1 answer
Welcome to MathHomeworkAnswers.org, where students, teachers and math enthusiasts can ask and answer any math question. Get help and answers to any math problem including algebra, trigonometry, geometry, calculus, trigonometry, fractions, solving expression, simplifying expressions and more. Get answers to math questions. Help is always 100% free!
87,542 questions
99,804 answers
2,417 comments
523,093 users