The graph below illustrates the mechanism for calculating the upper and lower limits. The sloping lines represent the change in speed over the six seconds as presented in the table.
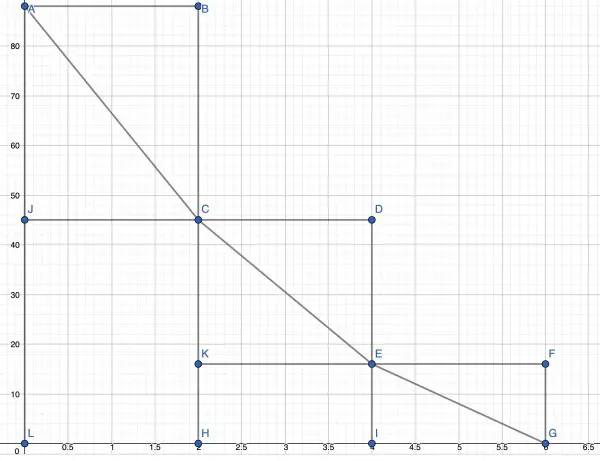
The rectangles enclose the sloping lines and the areas of these rectangles represent the upper and lower limits of the distances for each interval of 2 seconds.
The area of rectangle ABHL represents the upper limit of the distance travelled in the first two seconds, while the area of rectangle JCHL represented the lower limit of that distance.
The combined areas of the larger rectangles is the upper limit of the total distance travelled; likewise for the lower limit.
Larger areas are 2×88+2×45+2×16=176+90+32=298; smaller areas are 2×45+2×16+0=122.
So the lower estimate is 122 and the higher estimate is 298. The actual distance lies between these numbers.
The area under the straight sloping segments (trapezoids) is 210, which is the average of 122 and 298.
