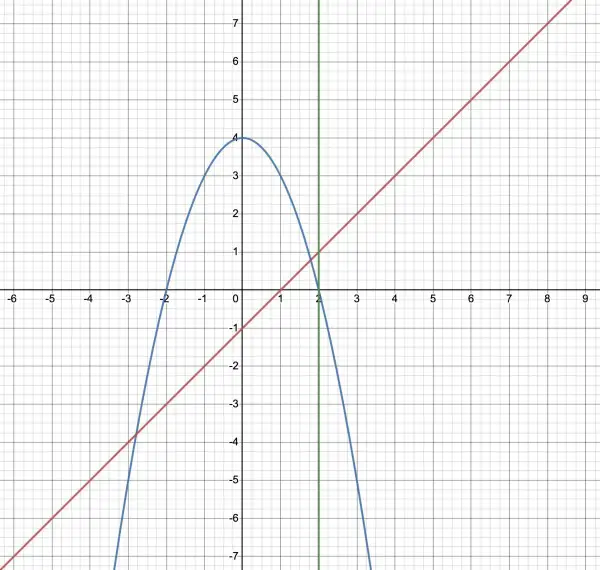
The picture shows two graphs: the blue curve is y=4-x2 and the red line is y=x-1.
The vertical green line is x=2. The piecewise function is the blue curve only up to and including the green line. Beyond the green line the piecewise function becomes the red line. So the blue curve ceases to exist on the right of the green line, while the red line ceases to exist to the left of, and including, the green line. The piecewise function is not continuous, but "jumps" from (2,0) to (2+,1+) where the plusses indicate that the line is open-ended (x>2 and y>1), while (2,0) is the terminal point on the blue curve. When drawing this piecewise function, erase the blue curve below the x-axis for values of x>2; also erase the red line where x<2. The green line is not part of the graph.