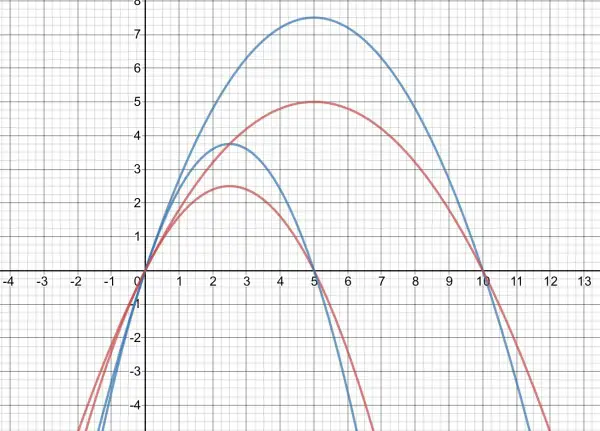
When P=k, the growth rate is zero (neither increasing or decreasing) which means the population size remains constant. In the graph the red curves have the same r value and the blue curves have the same k value. In all cases at t=0 (P₀ or P(0)=0) implying what would be expected: no population growth initially. At t=k/2 the pop growth is maximum. When t>k the population is in decline, that is, the growth rate is negative, or decreasing.