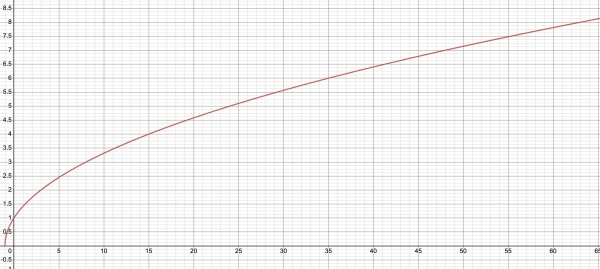
Make a table of values which you can plot. For example:
| x |
y=√(x+1) |
| -1 |
0 |
| 0 |
1 |
| 3 |
2 |
| 8 |
3 |
| 15 |
4 |
| 24 |
5 |
| 35 |
6 |
| 48 |
7 |
| 63 |
8 |
You need different scales for x and y to plot these points. x goes from -1 to 63, while y only goes from 0 to 8. The origin of the graph will be near the bottom left of the page. There can be no negative values of x lower than -1: The graph starts at (-1,0) and continues rightwards very gradually towards infinity, so it's very shallow. The graph should look something like this when you connect the points: