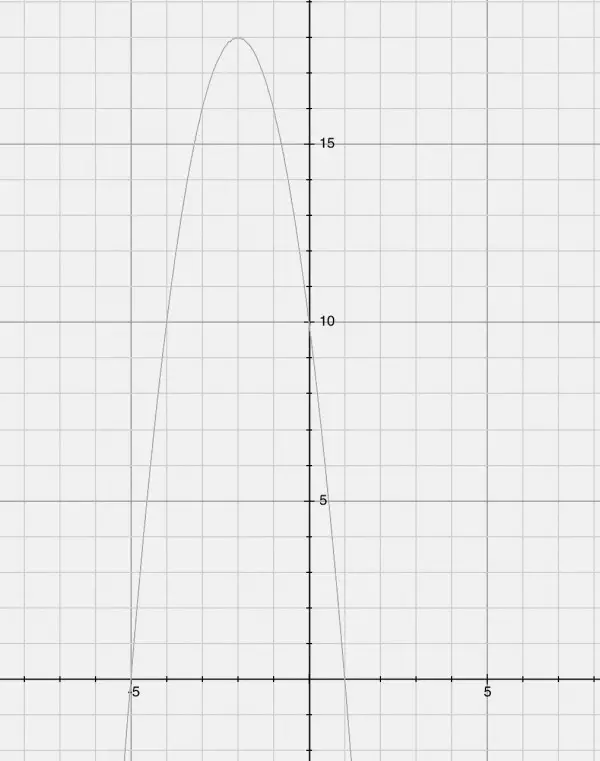
The graph shows the three intercepts: x intercepts at x=1 and -5; y intercept at y=g(x)=10. The graph is an inverted parabola. The vertex is at x=-2, y=g(x)=18, the point (-2,18). g(x)=-2(x^2+4x-5)=-2(x^2+4x+4-9)=-2(x+2)^2+18. This rearrangement shows the vertex better.