Draw three interlocking circles. This is a Venn diagram, and with it the problem is easier to solve. Surrounding the interlocking circles, draw a large circle. The four circles produce 8 regions A-H representing percentages:
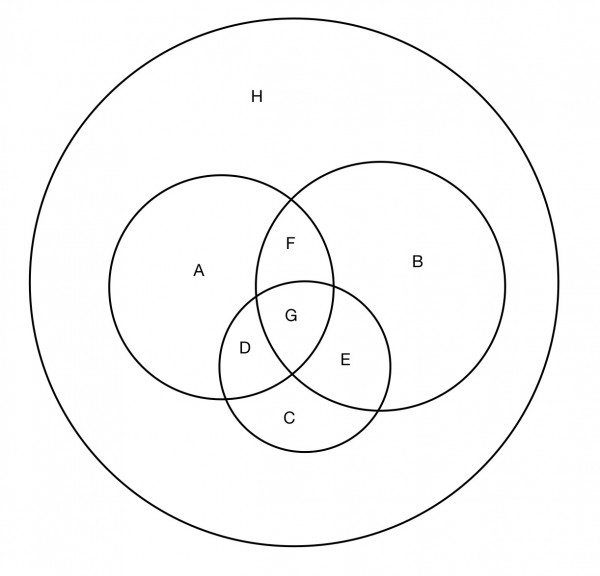
A. Athletics members only
B. Football members only
C. Hockey members only
D. Athletics and hockey members (not football)
E. Hockey and football members (not athletics)
F. Athletics and football members (not hockey)
G. All three
H. None
Now we can put in some figures:
A+B+C+D+E+F+G+H=100
B+E+F+G=60
C+D+E+G=56
A+D+F+G=50
G+E=26
D+G=20
F+G=30
G=10, so E=16, D=10, F=20.
And A=50-(D+F+G)=10; C=56-(D+E+G)=20; B=60-(E+F+G)=14
H=100-(A+B+C+D+E+F+G)=100-(10+14+20+10+16+20+10)=0
(a) B+E=14+16=30%
(b) D+E+F=10+16+20=46%
(c) H=0%