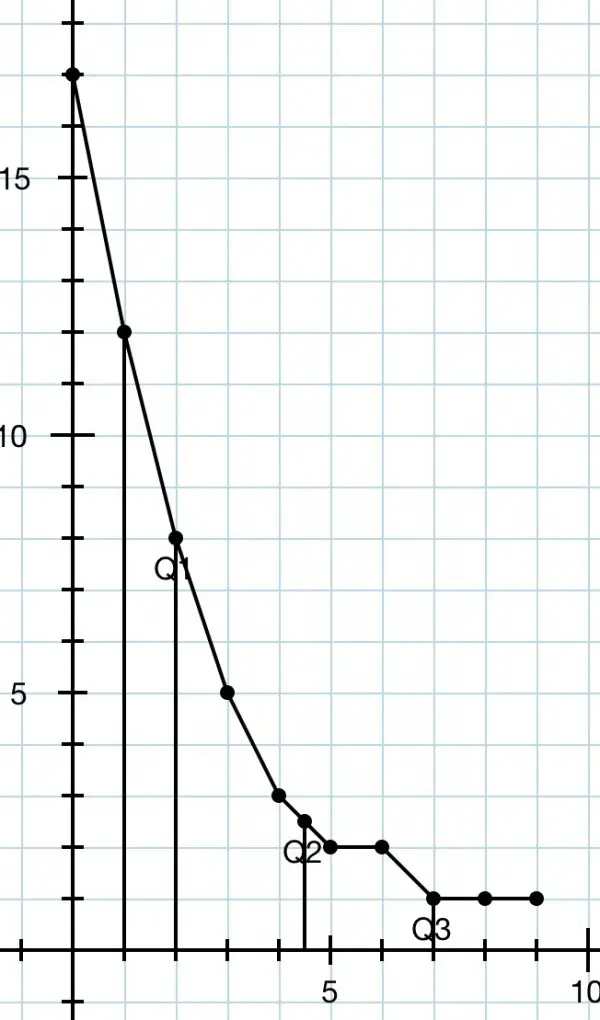
In the picture the quartiles are shown for a particular distribution as an example. There are 10 data points, 5 to the left of the median and 5 to the right, because the median is the average of the two central data.
Q2 is in fact the median. This is the central datum or the average of the two central data values of the distribution. The vertical axis shows the data values. Note how the data is more "bunched" on the left. Q1 is the median of the data on the left of the median and Q3 the median of the data on the right of the median. |Q2-Q1|>|Q3-Q2|. This is the condition described in the question. The tail is longer on the right than on the left, so the distribution is tailing off on the right, making it positively skewed (by definition of skewness). So the clue is in the tail. If it's longer on the right it is positive and on the left it's negative. (The gradient is much steeper on the left than it is on the right.)
At least I think that's right.