Not enough info. We need some stats to work from and we may be able to use a Venn diagram to solve the problem.
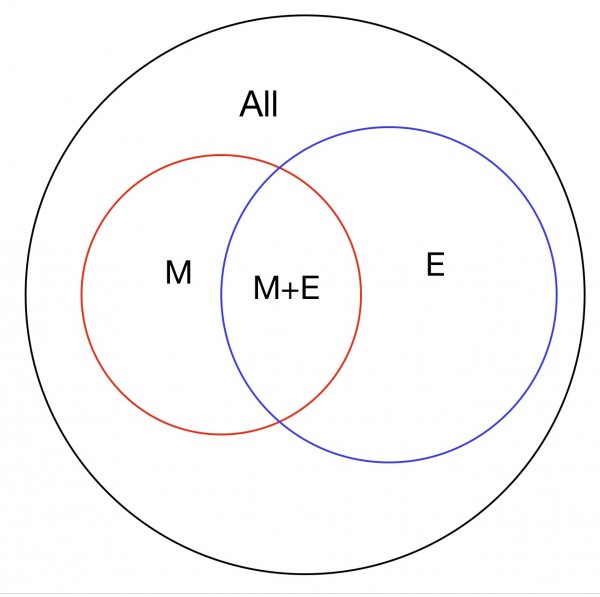
The black circle is the set of all students, the red circle the set of Math 1110 students and the blue circle English 1100 students. Where the circles overlap are students of both curriculae. The following regions apply:
All: students not involved in Math 1110 or English 1100
M: Math 1110 only
E: English 1100 only
M+E: Both
All+M+E+(M+E)=N(total students)
M+(M+E)=N(total Math1110 students)
E+(M+E)=N(total English 1100 students)
(M+E)=N(total combined Math 1110 and English 1100 students)
All=N(total students taking neither curriculum)
Given some N values (actual numbers or percentages), it’s possible from the equations above to find the probability N(combined Math/English students)/N(total students) and so determine whether or not it’s unusual to find a random student taking both courses.