Let y=f(x), then y'=dy/dx=cos(y)+4x.
Whatever f(x) is, cos(f(x)) or cos(y) always has a value between -1 and 1. Therefore 4x-1≤y'≤4x+1.
Integrating we get 2x²-x+c≤y≤2x²+x+c, where c is a constant. Graphically this means that f(x) lies in between two intersecting parabola. For a large magnitude of x (positive or negative) the parabola’s merge into one, y=2x²+c. The intersection of these parabolas is at (0,c), implying that the point (0,c) is on f(x), that is, f(0)=c, when y'=cos(c). We can use Euler’s Method to approximate to a curve for f(x), but the curve will depend on the constant c. A more practical way may be to set an arbitrary value for c to gain a better idea of how f(x) behaves. The process is fairly tedious and time-consuming. As it happens, f(x) lies between 2x²+x+c and 2x²+c, wandering between the two parabolas, and almost touching each one in turn.
We can also deduce that we have at least one minimum. y'=0⇒cos(y)=-4x, which is satisfied when, for example, x=0 and y=(2n+1)(π/2) for integer n. y"=-sin(y)y'+4=4>0 when y'=0, so minimum is implied when these conditions are met. Because |cos(y)|≤1, -0.25≤x≤0.25 for all minima.
y=f(x) specifically implies that x maps to a unique value of y—x cannot map to multiple values of y because that would invalidate the fundamental property of a function.
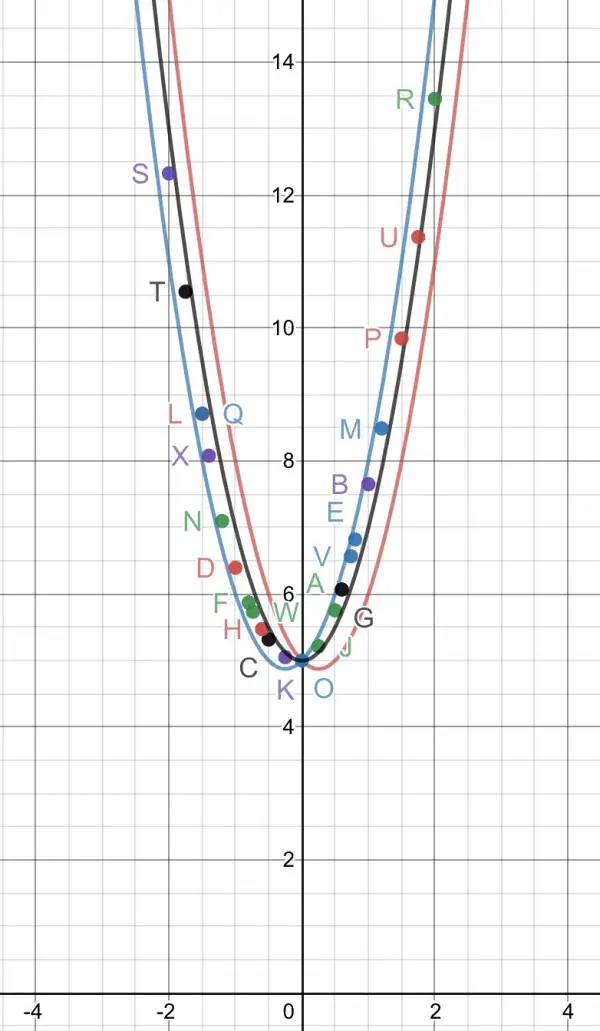
The red and blue parabolas form an envelope for f(x). The black parabola lies in between them y=2x²+c and Euler’s Method was used to plot approx points on f(x), and you can see it lies between the black and blue parabolas. The blue parabola has the equation y=2x²+x+c, and for the purposes of illustration c=5. Close inspection shows that f(x) shifts “wiggles” between the two parabolas, almost touching them as it does so. Euler’s Method assumes that a point (x,f(x)) on the curve is known, so using c=5 I have used (0,5) as that point to determine a slope dy/dx=cos(y)+4x at (0,5), so dy/dx=cos(5), and ∆y≃(cos(y)+4x)∆x, where ∆x is a small arbitrary value (I used ∆x=0.01), so we can work out the coords of a point close to (0,5) given by (x+∆x,y+(cos(y)+4x)∆x). This evaluates initially to (0.01,5+0.01cos(5)). This point is then used to plot the next point, and so on. The resultant curve is only an approximation. The points have been arbitrarily labelled for identification: A, B, ...
More to follow...