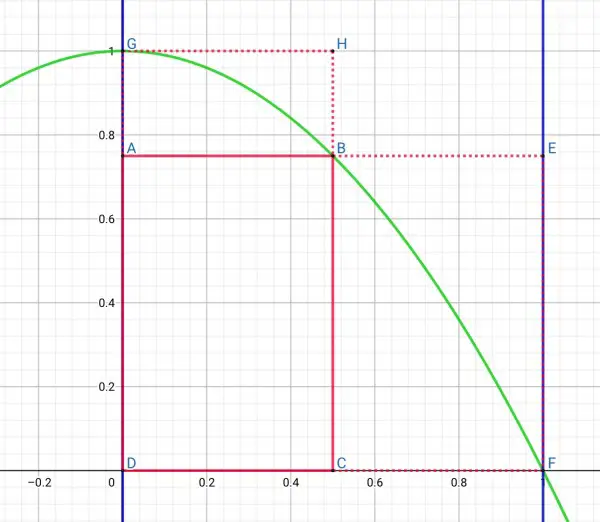
The curve y=1-x² is shown in green.
The vertical blue lines show the limits of the integration [0,1].
The red rectangle ABCD is created by working out the value of y when x is the midpoint of the integration interval, that is, x=0.5, so y=1-0.5²=1-0.25=0.75.
The area of ABCD is 0.5×0.75=0.375 square units. This is as an underestimate of the the area under the curve, that is, the definite integral between the limits x=0 and x=1.
ABCD is below the curve, but if we consider the two dotted red rectangles GHCD and BEFC the curve will be enclosed, giving us an overestimate of the area, the sum of their areas=1×0.5+0.75×0.5=0.5+0.375=0.875 square units.
Therefore the actual integral will be between the underestimate and overestimate, so we could take the average=½(0.875+0.375)=1.25/2=0.625. This is fairly close to the actual integral of ⅔.