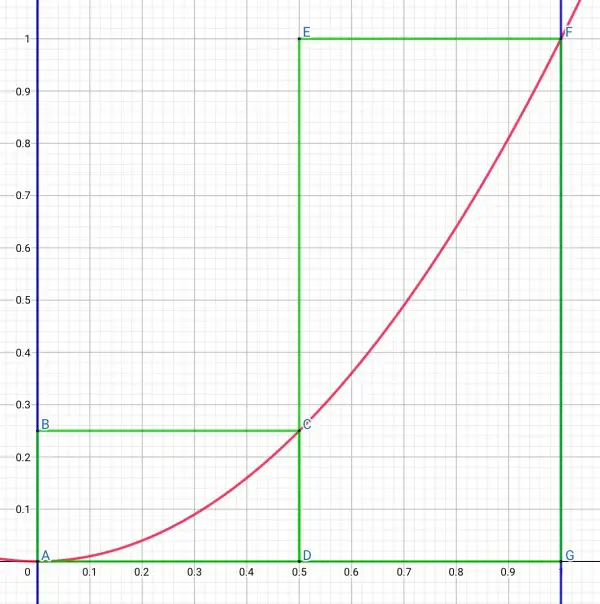
y=x² is shown as a red curve. The green rectangles ABCD and DEFG have equal width, but different height, and they enclose the curve. The sum of their areas approximates to the area below the curve. This sum will be an overestimate of the actual area. The point C is (0.5,0.25) because y=0.5²=0.25, according to y=x². This gives the height of ABCD. The height of DEFG is FG=1, because y=1²=1.
[The right-hand sum simply tells us which side of the rectangles is taken to be the height. The right side of ABCD is CD which has length 0.25 and the right side of DEFG which has length 1. The left-hand sum would have made ABCD flat (AB=0, no area) and DEFG would have had a height CD=0.25 and area 0.125. So the sum of the areas would have been only 0.125, an underestimate because the rectangles would sit under the curve. The true area between the red curve, the blue lines and the x-axis (usually called the definite integral) would be between the left-hand and right-hand sums.]
Anyway, back to the problem. Area ABCD=0.5×0.25=0.125, area DEFG=0.5×1=0.5. Total area=0.625 square units. This is an approximation (overestimate) of the area enclosed by the blue lines (x=0 and x=1) and the x-axis.