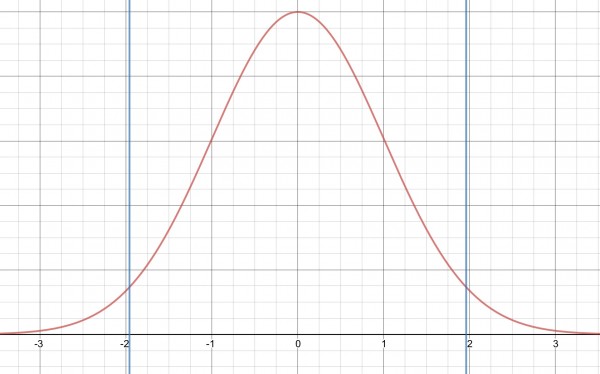
The area under the distribution curve between the blue lines is the required interval. The left blue line corresponds to Z=-1.96 and the right blue line to Z=1.96. Each of the areas in the tails sum to 5%, so because of symmetry, the area of the right tail is 2.5%. The Z value of 1.96 corresponds to 97.5%, so we need to find what H (high) and L (low) values this corresponds to:
1.96=(H-65.5)/2.5 and -1.96=(L-65.5)/2.5.
4.9=H-65.5, -4.9=L-65.5, H=70.4 in, L=60.6 in.
So the interval could be written 65.5±4.9, 60.6≤X≤70.4, or [60.6,70.4].