Consider the ordered dataset: 3.5, 3.5, 3.5, 3.5, 5, 7, 9, 11, 12.5, 12.5, 12.5, 12.5.
The lower limit is 3.5 and the upper limit 12.5.
Q1=3.5, Q2=Median=8, Q3=12.5 for the quartiles. The box plot is shown below:
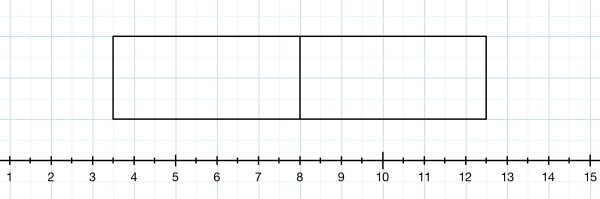
When the data range is the same as the interquartile range there are no whiskers.