BOX PLOT AS SHOWN TO SCALE:
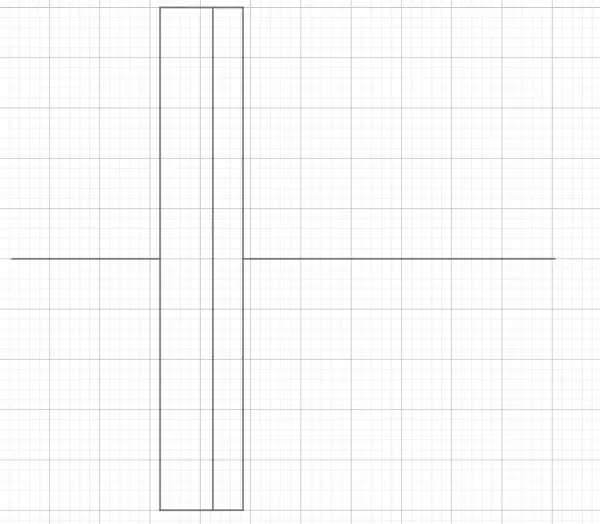
Last datum (4.01) is an outlier.
Quartile positions Q1=2.44, Q2=2.65 (median), Q3=2.77. Q1 and Q3 are represented as the rectangle borders, with the median as an inner vertical line. The interquartile range is the horizontal width of the rectangle and the “whiskers” are the data below Q1 and above Q3. The data range is represented by the horizontal line to the left and right of the rectangle.
This is how I worked it out. There are 15 ordered data elements, and the middle one is the 8th element 2.65. This is the median, also called Q2, where Q means quartile. So there are 7 elements on each side of Q2. The central element on each side gives us Q1 (lower) and Q3 (upper) which are the 4th and 12th elements respectively. Q1=2.44 and Q3=2.77. These two quartile numbers form the left and right sides of the box (rectangle) while Q2 is the vertical divider. The box plot has whiskers, composed of the data that doesn’t lie between Q1 and Q3. The longer right hand whisker shows that there’s an outlier at 4.01. Half the data lies within the box between Q1 and Q3.