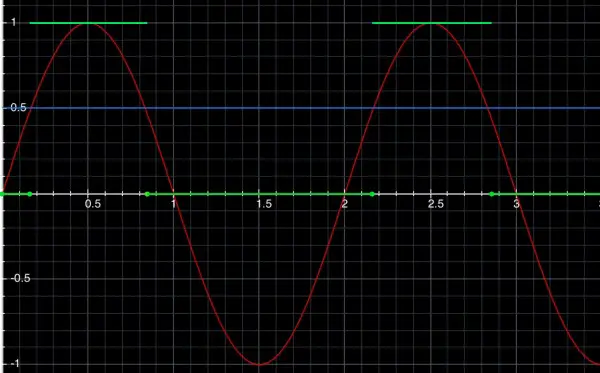
(a) s(t) is shown as the red curve, g(t) is shown as the green lines. The blobs on the ends of a line mean the end points are included, and when there are no blobs, the end points are excluded. The blue line divides s(t) into two parts to show when it’s greater than or when it’s less than a half. You can see from this line how the decision is made to draw the green line along the t axis (g(t)=0) or at g(t)=1.
(b) s(t) is continuous, but g(t) is discontinuous because it jumps between 0 and 1.
g(t)={ 0 | sin(πt)≤½
{ 1 | sin(πt)>½
where t≥0
The switch from 0 to 1 and vice versa occurs at t=⅙, ⅚, 2⅙, 2⅚, 4⅙, 4⅚, etc. So the organism reacts for ⅓ of the time, and fails to react for ⅔ of the time for every cycle.
Another way of defining g(t) is:
g(t)={ 0 | 0≤t≤⅙
{ 1 | 2n+⅙<t<2n+⅚
{ 0 | 2n+⅚≤t≤2(n+1)+⅙
where n is an integer and n≥0