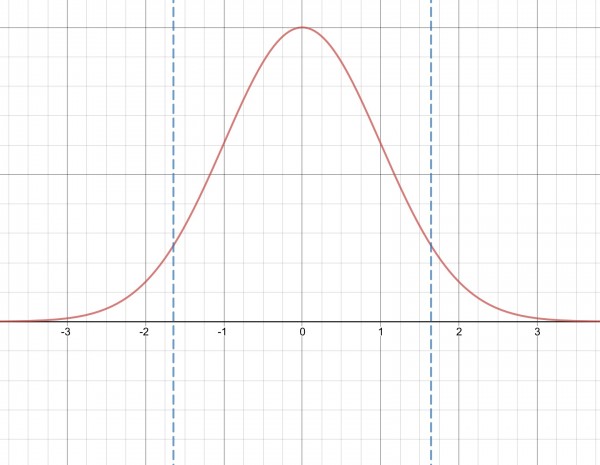
The picture shows the normal distribution curve with Z values along the horizontal axis. Z=0 represents the mean which splits the area under the curve into two equal parts. On the left are negative values for Z and on the right are positive values. The area under the curve represents probabilities. The two vertical dotted lines split the areas. The left dotted line is at Z=-1.645 and the right at Z=1.645. The area of the curve between the two lines represents the confidence interval of 90% with 5% in each of the two tails. This picture should help to make sense of this question and its solution.
The Z-score is calculated from Z=(x bar-µ)/(σ/√n), where µ and σ are the population mean and standard deviation. x bar=6784, n=15. We can rewrite the equation to find µ in terms of the other values:
µ=x bar-Zσ/√n, and we have two values for Z on either side of the mean, so we get two values for µ and this is where we get the range of values for µ. But we don’t have the population standard deviation, we have the sample standard deviation, s, so we need to consult a t-table to find a critical value for n-1=14 degrees of freedom and a 2-tail significance of 0.10. That value is T=1.761 and we use this in place of Z: Ts/√15=157 approx. Therefore we have the range for µ: 6784±157=(6627,6941), in other words 6627<µ<6941.