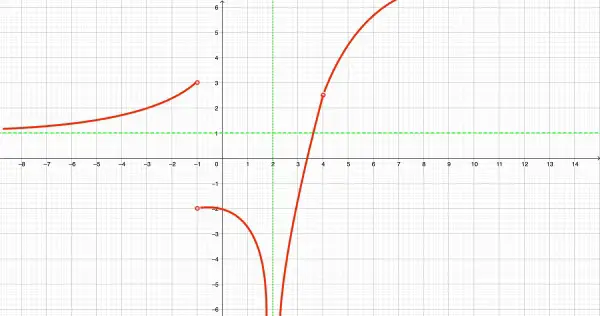
The graph looks something like this. The tiny circles at (-1,3), (-1,-2) and at x=4 show discontinuities (non-existent points of f(x)). The green broken lines are horizontal and vertical asymptotes. The red curves represent f(x), showing how they meet up with the discontinuities. f(x) approaches, but never touches, the asymptotes. Note that the discontinuity at x=4 has an arbitrary f(x) value (not necessarily what is shown).