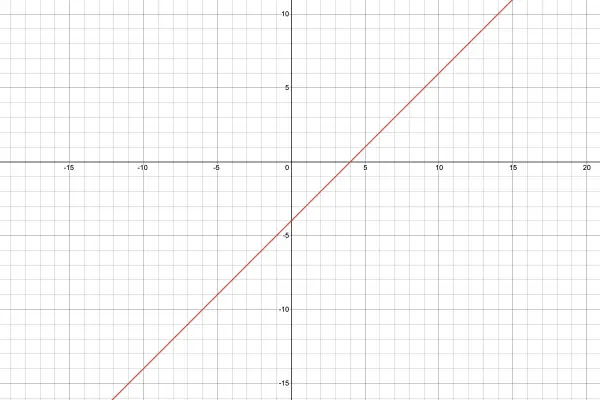
This is a linear graph because we have no powers of x greater than 1, so it's easy to plot because it's a straight line. If we use the intercepts we can just draw a straight line through them. To find the x-intercept we solve h(x)=0, that is, x-4=0, so x=4 is. the x-intercept. To find the y-intercept we calculate y=h(0)=-4. The red line passes through these two points, so this is the required graph.