If s is the distance the cheetah runs and it starts from a resting position to accelerate at a metres/sec2 to achieve maximum speed u m/s in a straight line then:
If it takes T seconds for the cheetah to get up to speed and then maintain that speed for 25 more seconds, then: the distance over which it is accelerating is s1=½aT2 and u=aT. The distance it runs at maximum speed for 25 seconds is s2=25u, so the total distance it runs is s=s1+s2=½aT2+25aT=aT(½T+25).
We don't have a table so we need to put in some values for the variables.
For a cheetah, T=3 seconds approx to accelerate to maximum running (chasing) speed and a=10 m/s2.
So s=30(1.5+25)=795m.
A plot of distance (vertical axis=s) against time (horizontal axis=t) gives a graph illustrating the distance covered in a given amount of time.
So a table can be produced using the formula. The slope of the graph at any time shows the speed. In actual practice, the cheetah will be moving from side to side when chasing prey so the movement is not in a straight line. However, for the purposes of this exercise we'll assume that it is moving in a straight line to get to its prey. The figures are for illustration purposes only.
| time t |
distance |
speed |
| (seconds) |
(metres) |
m/s |
| 0 |
0 |
0 |
| 1 |
5 |
10 |
| 2 |
20 |
20 |
| 3 |
45 |
30 |
| 4 |
75 |
30 |
| 5 |
105 |
30 |
| 10 |
255 |
30 |
| 15 |
405 |
30 |
| 20 |
555 |
30 |
| 25 |
705 |
30 |
| 27 |
765 |
30 |
| 28 |
795 |
30 |
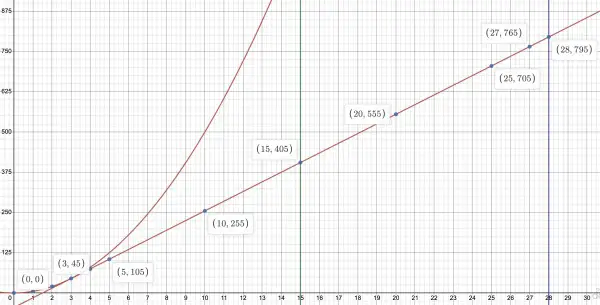
Picture powered by Desmos
The blue dots represent the points contained in the table. The vertical lines are two arbitrary times (15 secs and 28 secs). The red curve and line show respectively and separately the acceleration part of the run and the constant speed part. The time-distance track of the cheetah follows the dots. The curve shows the effect of continuous acceleration (after 3 seconds doesn’t apply here). The red line shows the constant speed (before 3 seconds doesn’t apply).