if x = 85, s = 8, and n = 6, construct a 95% confidence interval estimate of the population mean, m

**USING EXCEL***
in Statistics Answers by

Your answer

Your name to display (optional):
Privacy: Your email address will only be used for sending these notifications.
Anti-spam verification:
To avoid this verification in future, please log in or register.

1 Answer

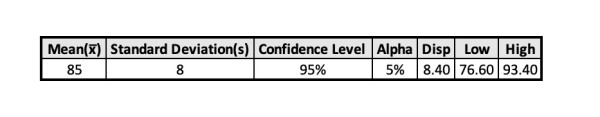
This is how I set up the data in Excel, showing the given mean and standard deviation of the sample, and the required confidence level for the interval. Alpha, the significance level, is 100-(Confidence Level), and we ask Excel to find the critical value using the CONFIDENCE.T function, which has three parameters: alpha, standard deviation and sample size=6. The result is Disp (for displacement).

Low and High show the lower and upper limits.

Excel will use a 2-tail t-distribution with 5 degrees of freedom (sample size-1=5) to determine the multiple of s that will be used to calculate the interval. Excel divides s by √6 to derive the margin of error. The Confidence Interval, CI=x̅±Disp=85±8.40 (2 dec place accuracy), giving Low and High extremes of the interval.

by Top Rated User (1.1m points)

Related questions

2 answers
asked Jul 6, 2021 in Statistics Answers by Mekaruu | 1.9k views
2 answers
1 answer
1 answer
Welcome to MathHomeworkAnswers.org, where students, teachers and math enthusiasts can ask and answer any math question. Get help and answers to any math problem including algebra, trigonometry, geometry, calculus, trigonometry, fractions, solving expression, simplifying expressions and more. Get answers to math questions. Help is always 100% free!
87,550 questions
99,628 answers
2,417 comments
440,457 users