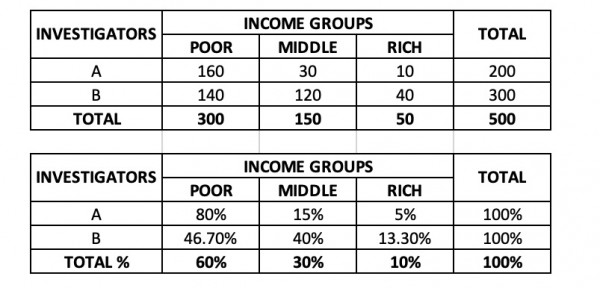
The top table is a representation of the given figures. The bottom table simply converts all the figures into percentages for better comparison. The widely differing percentages suggest that at least one investigator has based their grouping of incomes on opinion. To be truly meaningful, the income should be based on upper and lower limits which were defined and agreed by the researchers before the survey began. In this way opinion is ruled out. The sort of grouping would be: annual income of household below $10,000 (lowest income bracket); between $10,000 and $100,000 (middle income bracket); above $100,000. (These figures are only examples and do not necessarily reflect reality.)