it's graphs and equations.
in order of operations by

Your answer

Your name to display (optional):
Privacy: Your email address will only be used for sending these notifications.
Anti-spam verification:
To avoid this verification in future, please log in or register.

1 Answer

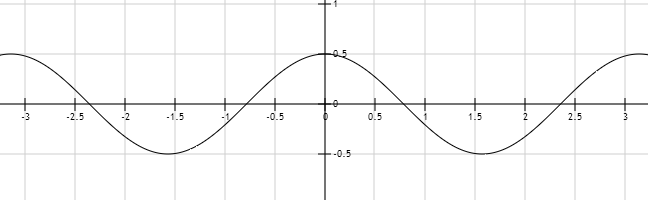
The graph y = cos (x) would look like this:

Then you just adjust it to fit the other coeffiencients given. In this question the amplitude (the number before the cosine) is 1/2, this means the maxiumums and minimums will be 1/2 and -1/2. The frequency is the term that is multiplied with the x term inside the cosine, in this question it is 2, so the graph will have 2 cycles everytime this one has 1. So the graph will start at y = 1/2 then the first x intercept will be at pi/4 then the first minimum will be at pi/2, then there will be another x intercept at 3*pi/4 and etc. It should look like this:


by

Related questions

1 answer
1 answer
1 answer
1 answer
1 answer
1 answer
asked Dec 12, 2011 in Trigonometry Answers by anonymous | 1.6k views
2 answers
0 answers
Welcome to MathHomeworkAnswers.org, where students, teachers and math enthusiasts can ask and answer any math question. Get help and answers to any math problem including algebra, trigonometry, geometry, calculus, trigonometry, fractions, solving expression, simplifying expressions and more. Get answers to math questions. Help is always 100% free!
87,542 questions
99,804 answers
2,417 comments
523,290 users