Plot the lines y=-2x-5 (red) and y=3x+4 (blue):
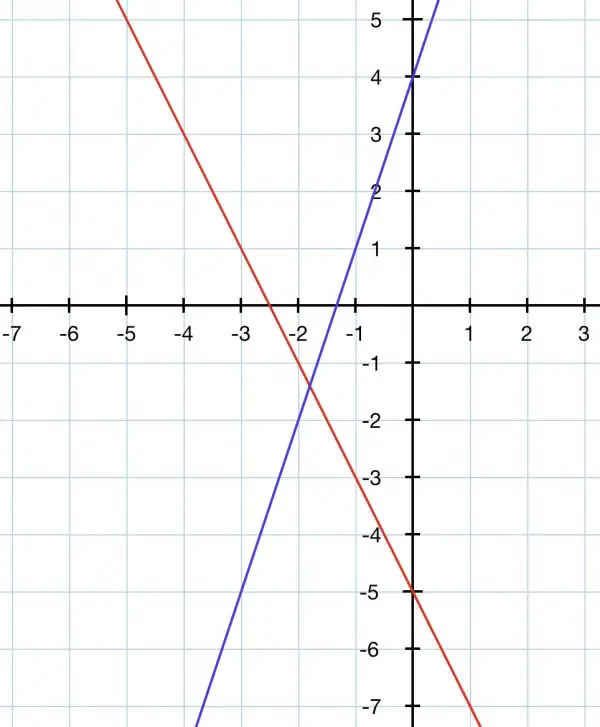
The first inequality is the whole area above the red line. The second inequality is the whole area above the blue line including the line itself. We need the region that is the area above both lines and lying on the blue line, which is the V-shaped region at the top of the X where the lines intersect.