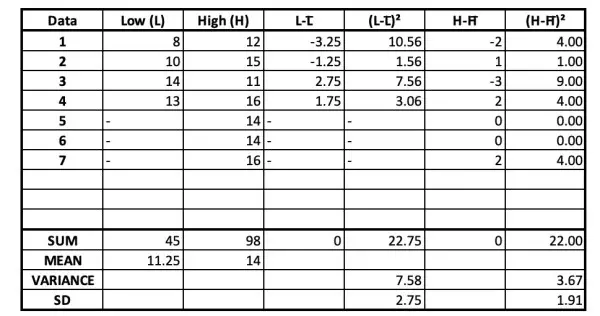
The table shows the data for the high and low protein chickenfeed samples.
Only 4 data values, not 5, were given for one sample. The means are simply the sum of the data divided by the sample size. The variances are calculated by summing the squares of the differences between each data value and the relevant mean, then dividing by one less than the sample size, which is the number of degrees of freedom for each data sample.
The standard deviations (SDs) are the square roots of the relevant variances.
The null hypothesis H0 is that there is no significant difference between the means of the two data samples.
The alternative hypothesis H1 is that the high protein diet results in a weight increase in the chickens.
The difference between the two means is 14-11.25=2.75oz. The test statistic t=2.75/s, where s is SD for the difference of the means.
s=√(7.58/4+3.67/7)=1.56 approx, making t=2.75/1.56=1.77 approx. This means that the difference in the means is 1.77 SDs. This needs to be compared with the critical value expected for the 95% confidence level being applied.
We now need to decide on the degrees of freedom, and this is usually taken to be one less than the lower of the sample sizes, which would be 4-1=3 in this case.
The critical value from t tables for a 95% confidence level is 2.353. Since 1.77<2.353, it is within the bounds of H0, that is, there is no significant difference between the means of the two samples (the low protein diet is taken to be the control group, because the exercise is to judge the effectiveness of the high protein diet against that of the low).
CONCLUSION
H0 cannot be rejected, so we can be 95% certain that the high protein diet has not affected the average weight of the chickens.