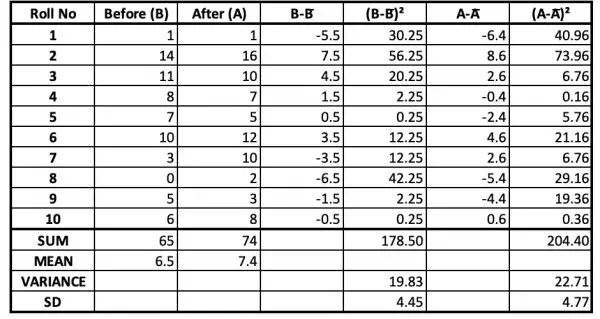
The table shows statistics taken from the given information. The "Before Treatment" sample is the control group. It's used to judge the "After Treatment" sample regarding the effectiveness of the treatment. In each case n=10.
B̅=(∑B)/n, A̅=(∑B)/n where B and A represent the memory capacity statistic.
VB=(∑(B-B̅)2)/(n-1), VA=(∑(A-A̅)2)/(n-1). Note that n-1 is used rather than n because there are n-1 degrees of freedom when the sample size=n. This is because, knowing the mean, only n-1 of the data are independent; the remaining value can be calculated, so it's not independent, and the degrees of freedom reflect independence.
What we have to do now is to decide whether the difference between the two sample means is significant. The difference is 7.4-6.5=0.9.
So we now have some basic statistics to set up the hypotheses.
Null hypothesis, H0: there is no significant difference between the means; alternative hypothesis, H1: there is a significant difference between the means.
Note that H1 implies that training could have a negative or positive effect, rather than just a positive effect. For the training to be considered effective, that is, training improves the memory, H1 needs to be restated: mean(after training)>mean(before training). H0 is unaffected. It's important to note this difference between the H1's because it affects whether we have a 1- or 2-tailed test. 1-tailed test applies to positive effect and the 2-tailed test to the positive or negative effect. Let's assume H1 is mean(after training)>mean(before training).
The test statistic t-score=(difference in the means)/(SD for the difference). (The sample sizes are small so we should use the t-test rather than the Z-score.)
Difference in the means=0.9.
sB=√VB, sA=√VA.
SD for the difference, s=√(sB2/10+sA2/10)=√(VB/10+VA/10)=√(1.983+2.271)=2.063.
So t=0.9/2.063=0.44 approx.
We have a 5% significance level (95% confidence level), from which tables show for degrees of freedom=9 (one less than the sample size) the critical value is 1.833. Any t value above this would mean that we reject H0. But 0.44<1.833, considerably less in fact, so we cannot reject H0. So we can be 95% certain that the "After Treatment" results have no significant effect on memory. The critical value from tables determines how many standard deviations higher than the mean we can go before we have to reject H0.