Consider the ordered dataset: 3, 3, 3, 4, 5, 7, 9, 11, 12, 13, 13, 13.
The data divides into two halves: 3, 3, 3, 4, 5, 7 and 9, 11, 12, 13, 13, 13. The median of all the data is between 7 and 9 so median=8. The medians of the two halves are 3.5 and 12.5, the values midway between 3 and 4 and 12 and 13. These are the first and third quartiles.
So Q1=3.5, Q2=8, Q3=12.5 for the quartiles. The box plot is shown below:
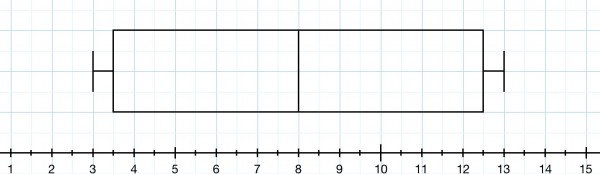
The whiskers are short because data outside the interquartile range are close to the limits of this range.