(33)
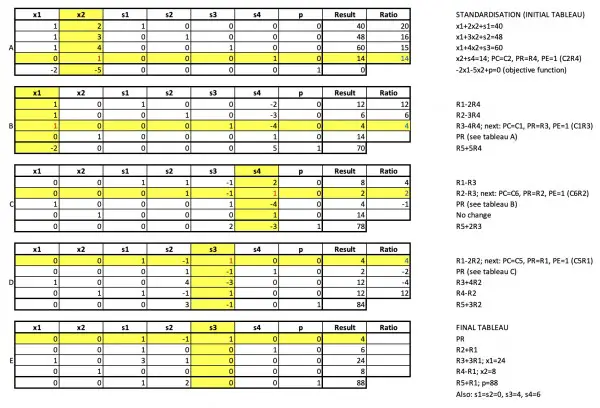
Apologies for the small text, but it was necessary to show all the main tableaux.
An explanation will be provided in due course, following a similar set of tableaux for question 34.
See my solutions for later questions. These solutions go into more detail and can be used to explain the pictured tableaux.
(34)
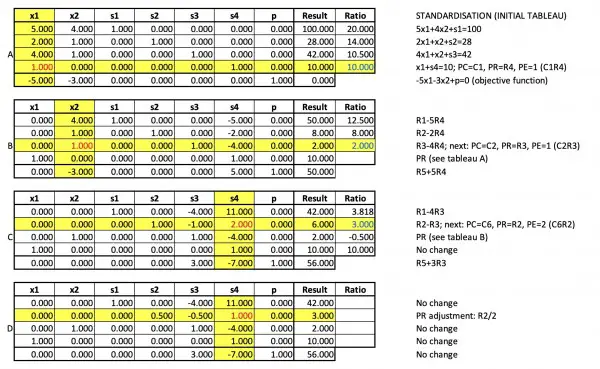
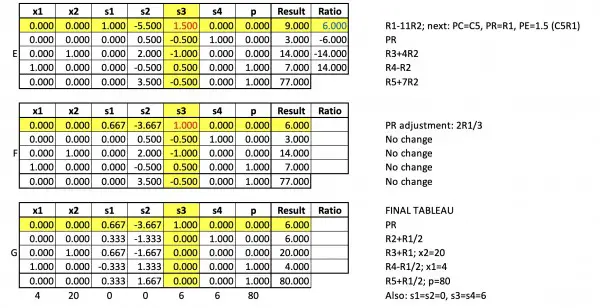
After standardisation, the simplex method just consists of solving a system of equations to find all 7 variables using systematic row manipulation.
Slack variables (so-called because they take up the slack in inequalities) are easy to evaluate once the main variables have been calculated. If you substitute the numbers below the final tableau for the variables in all the tableaux and multiply by their indicated coefficients, you will find that you get the values in the results column for each row. Each row corresponds to an equation.
The descriptions alongside rows describe the row operations. In the Ratio column is the quotient of the Result column with each row in the pivot column and the lowest quotient is shown in blue. See Tableau A for an example. In red is the pivot element. For other tableaux the pivot column, row and element are shown in yellow but these often apply to the next tableau (look for "next" in the description), not the current one. The current pivot row is indicated by PR against the row in the description. The tableaux shown are transitional: they combine using the pivot element from the previous tableau with processing the other rows so that only the pivot element in the pivot column is 1, while row manipulations ensure that other elements in the pivot column are zero. The row manipulation operations are indicated in the description. For example, R3+4R2 means that row 2 (R2, the pivot row elements defined in the previous tableau) are multiplied by 4 and added to corresponding elements in row 3 in the previous tableau and the results appear in row 3 of the current tableau. These transitional tableaux were devised to limit the number of tableaux and make the solution method more concise. They show the significant tableau changes needed to arrive at a solution.